Magento Chrome Toolbar for MSP DevTools
Magento Chrome Toolbar is a chrome extension to be used with MSP_DevTools for Magento 1 or Magento 2.
This extension allows you to quickly access the information you need to debug your Magento performances, to build your new theme or to modify an existing one.
How can I install it?
Just install from Chrome WebStore. Now you have the Chrome extension, next step is to install and configure the Magento extension.
Installing on Magento 1:
- Download and unzip in the Magento root: https://github.com/magespecialist/m1-MSP_DevTools/archive/master.zip.
- Flush your cache.
- Open Magento backend and go to
System > Configuration > MageSpecialist > DevTools. - Enable devtools and set IP restrictions.
- Optionally download PhpStorm Remote Call Plugin if you wish to integrate PhpStorm.
This package is also available on packagist for Magento 1 composer installation: composer require msp/devtools-m1
Source code available on GitHub: https://github.com/magespecialist/m1-MSP_DevTools
Installing on Magento 2:
- From your CLI run:
composer require msp/devtools - Flush your cache.
- Turn OFF Full Page Cache while you are using DevTools.
- Upgrade database data & schema:
php bin/magento setup:upgrade - Open Magento backend and go to
Stores > Settings > Configuration > MageSpecialist > DevTools. - Enable devtools and set IP restrictions.
- Optionally download PhpStorm Remote Call Plugin if you wish to integrate PhpStorm.
Source code available on GitHub: https://github.com/magespecialist/m2-MSP_DevTools
Enabling profiler feature on Magento 2:
If you wish to enable the profiler feature you need to set the MAGE_PROFILER server variable to MSP\DevTools\Profiler\Driver\Standard\Output\DevTools. You can do it in several ways:
Editing index.php:
Add the following line at the very beginning on index.php and pub/index.php file:
$_SERVER['MAGE_PROFILER'] = [ 'drivers' => [['output' => 'MSP\DevTools\Profiler\Driver\Standard\Output\DevTools']] ];
Editing .htaccess file
Add the following line to your .haccess file:
SetEnv MAGE_PROFILER MSP\DevTools\Profiler\Driver\Standard\Output\DevTools
Known Magento bug: In Magento 2.1.3 (and probably previous version) you may have problems with profiler and ajax calls due to a core bug. If you are getting this kind of problem you should use the "index.php" modification way.
Enabling SQL query feature on Magento 2:
Edit app/etc/env.php file adding the following key: $config[db][connection][default][profiler] = 1
Example:
...
  ),
  'db' =>
  array (
    'table_prefix' => '',
    'connection' =>
    array (
      'default' =>
      array (
        'host' => 'localhost',
        ...
        'profiler' => '1',
      ),
    ),
  ),
  'resource' =>
  array (
...
How does it work?
You can access both Global Page Information and Item Information through Chrome Inspector.
Inspector integration
Global Page Information
From the main panel you can see information from:
- Theme
- Controller / Router
- Request parameters
- Layout and Layout updates
- Observers
- Data Models inspector
- Collections inspector
- Blocks, Containers, uiComponents
- Profiler
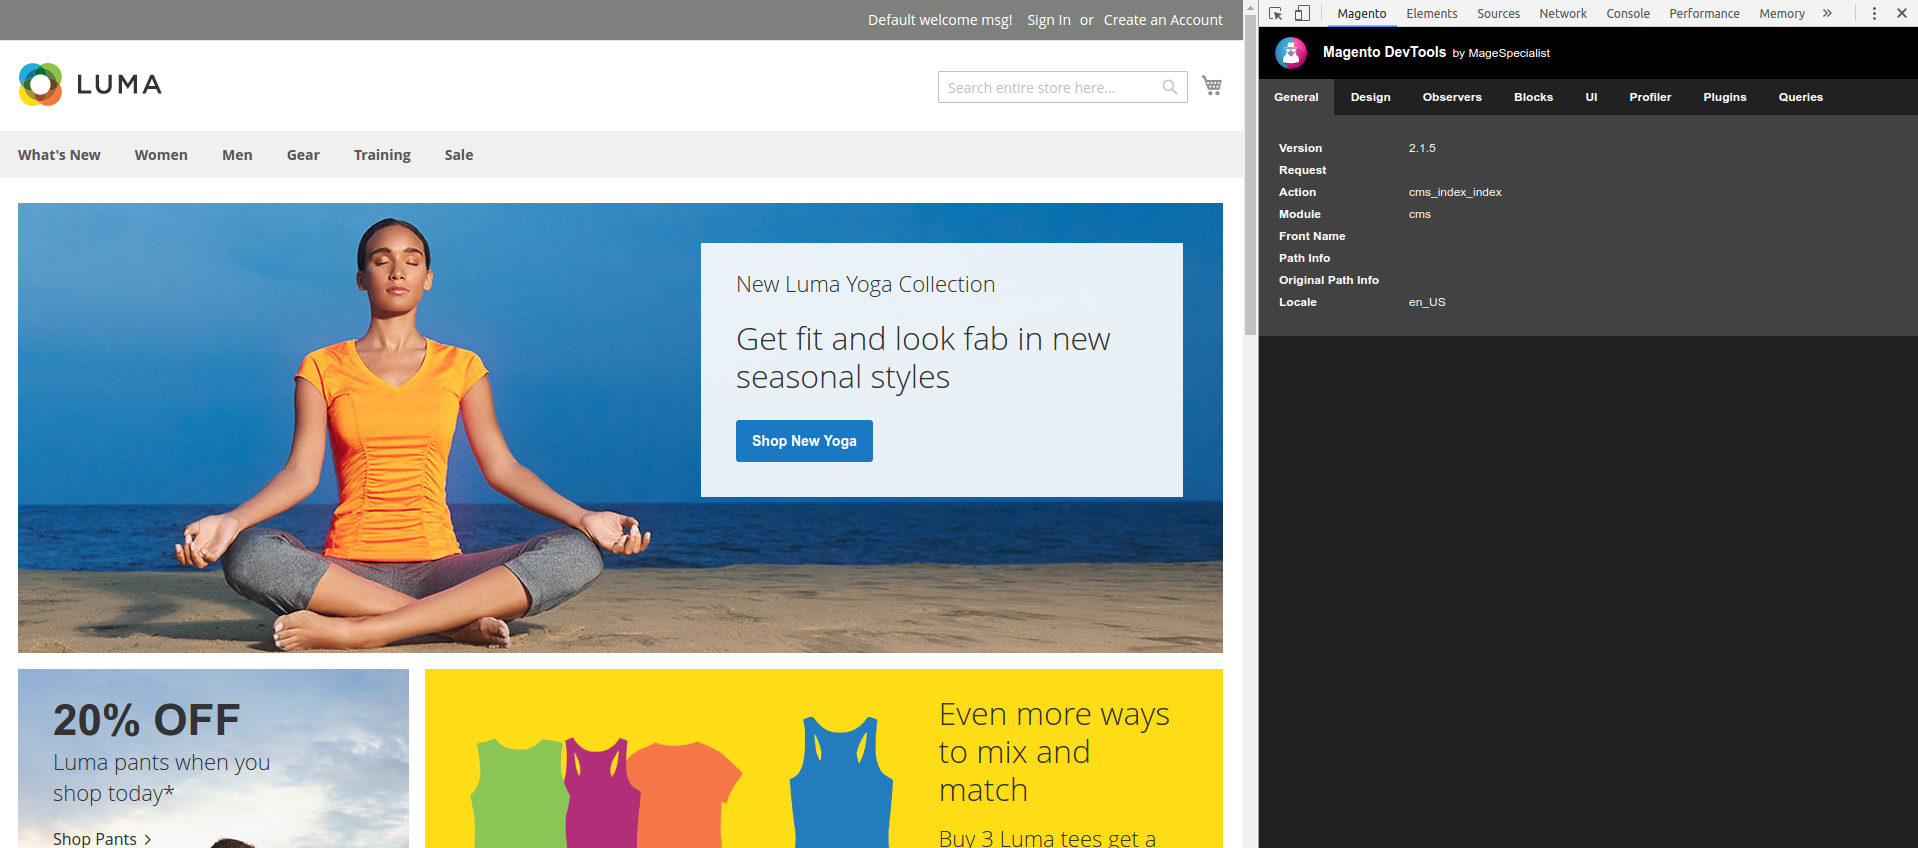
Theme, Controller and Global information:
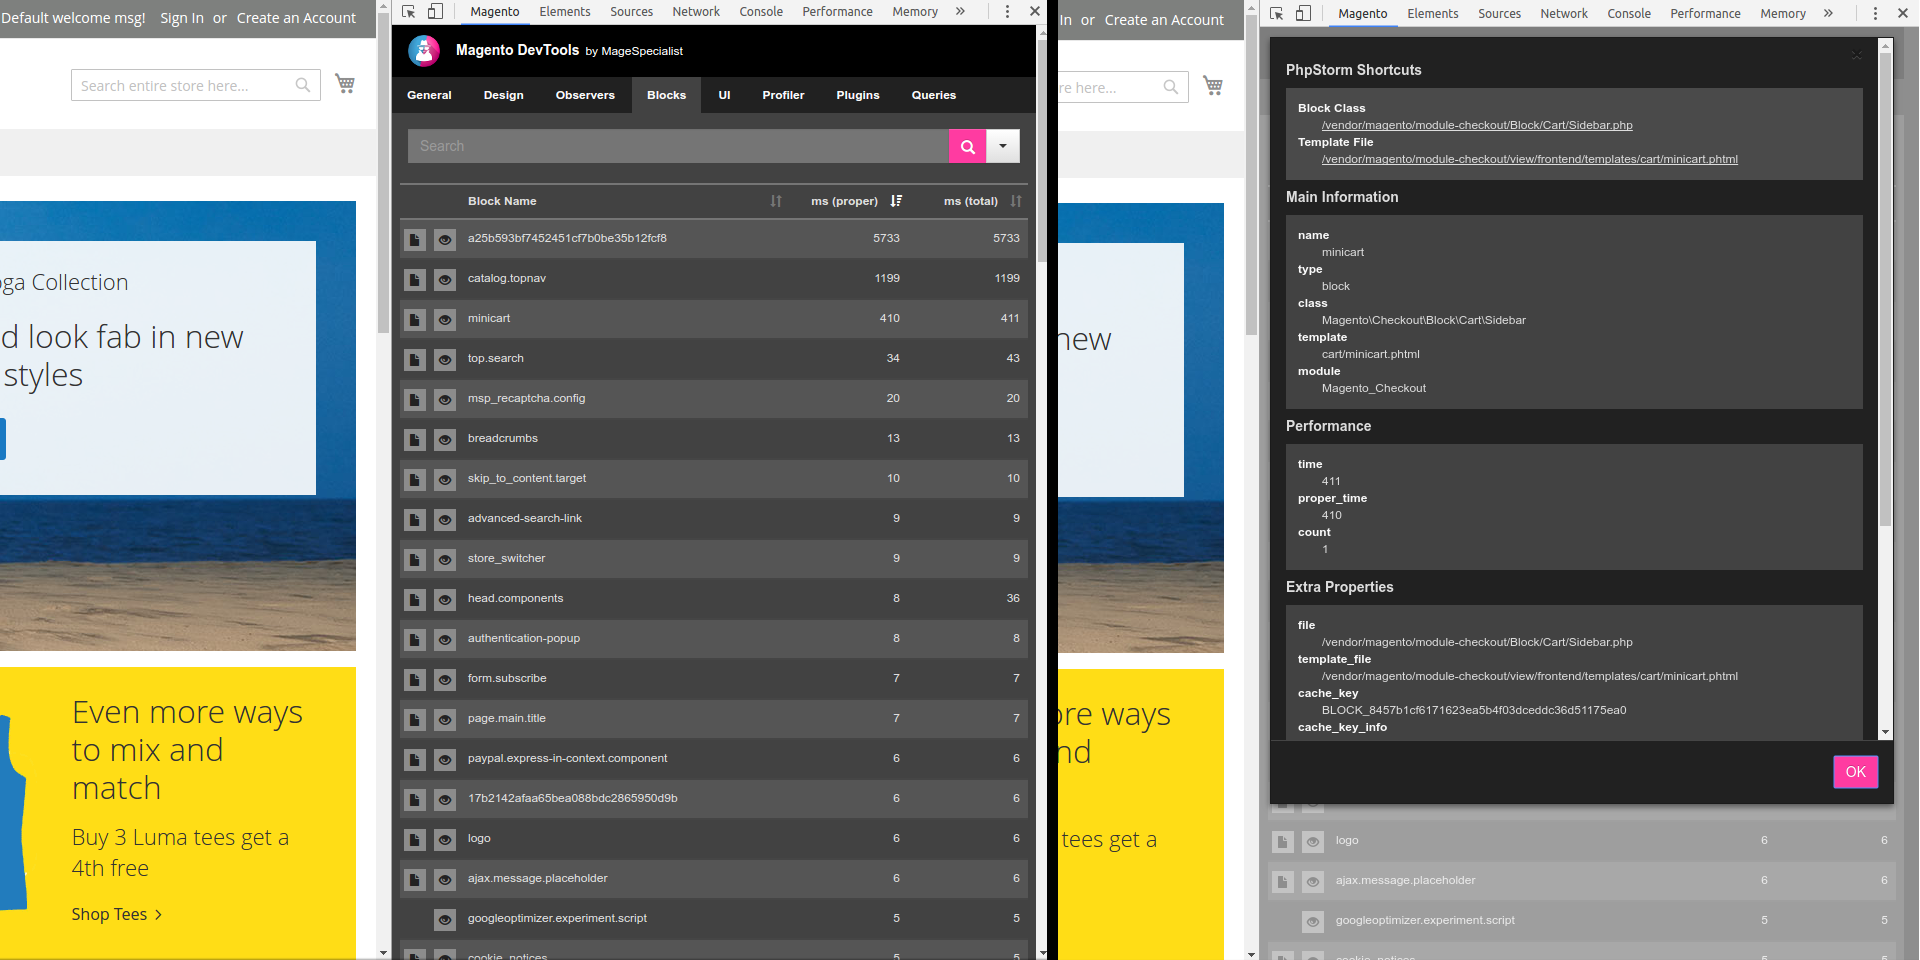
Blocks / Containers information:
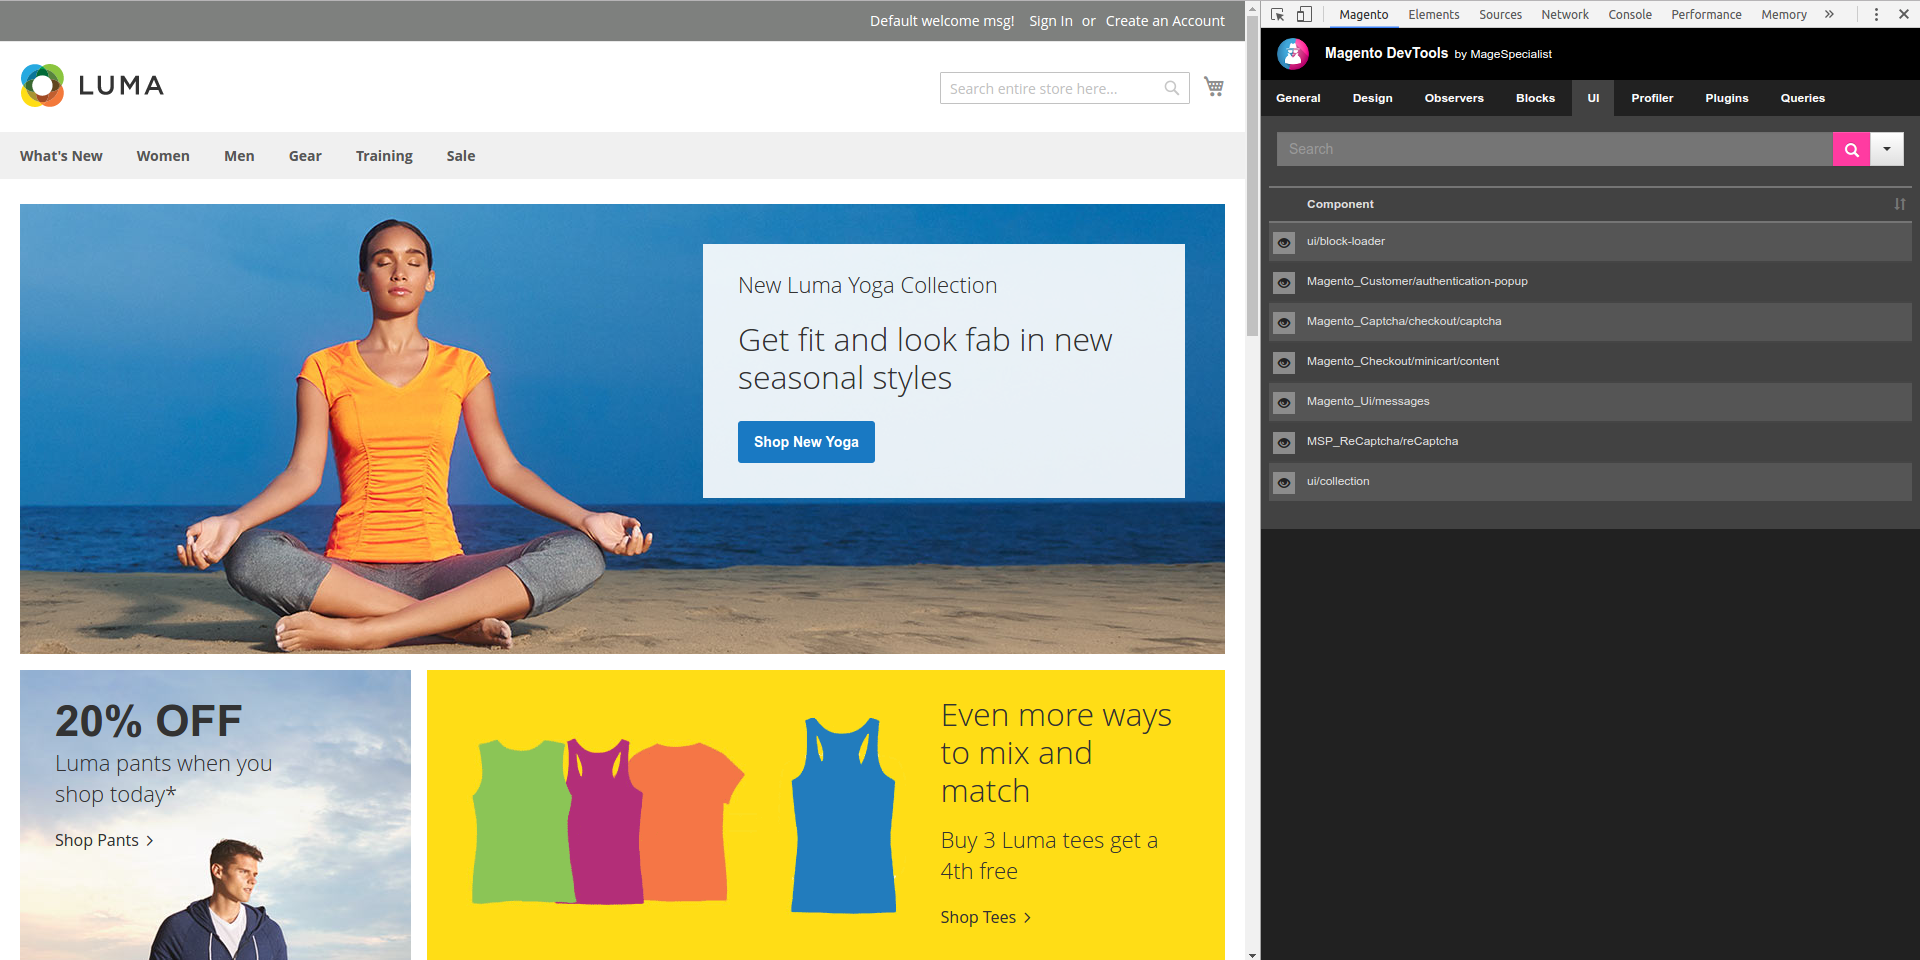
uiComponents information:
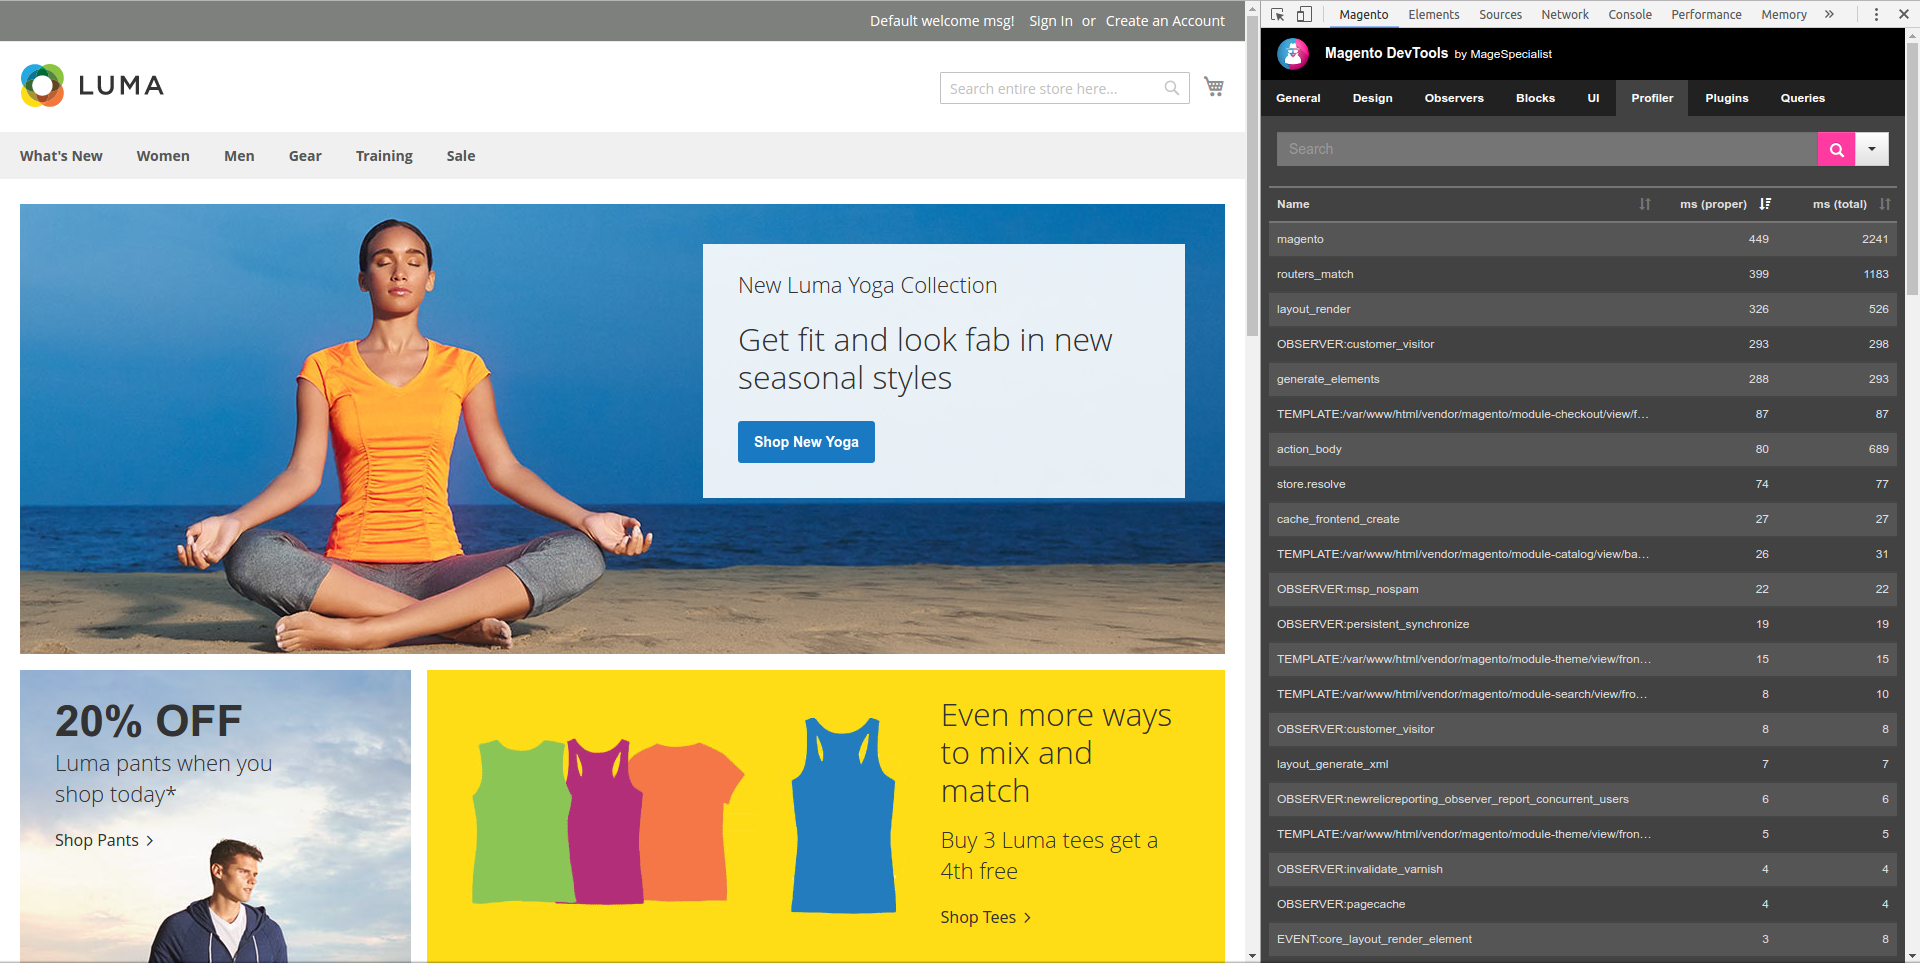
Profiler information:
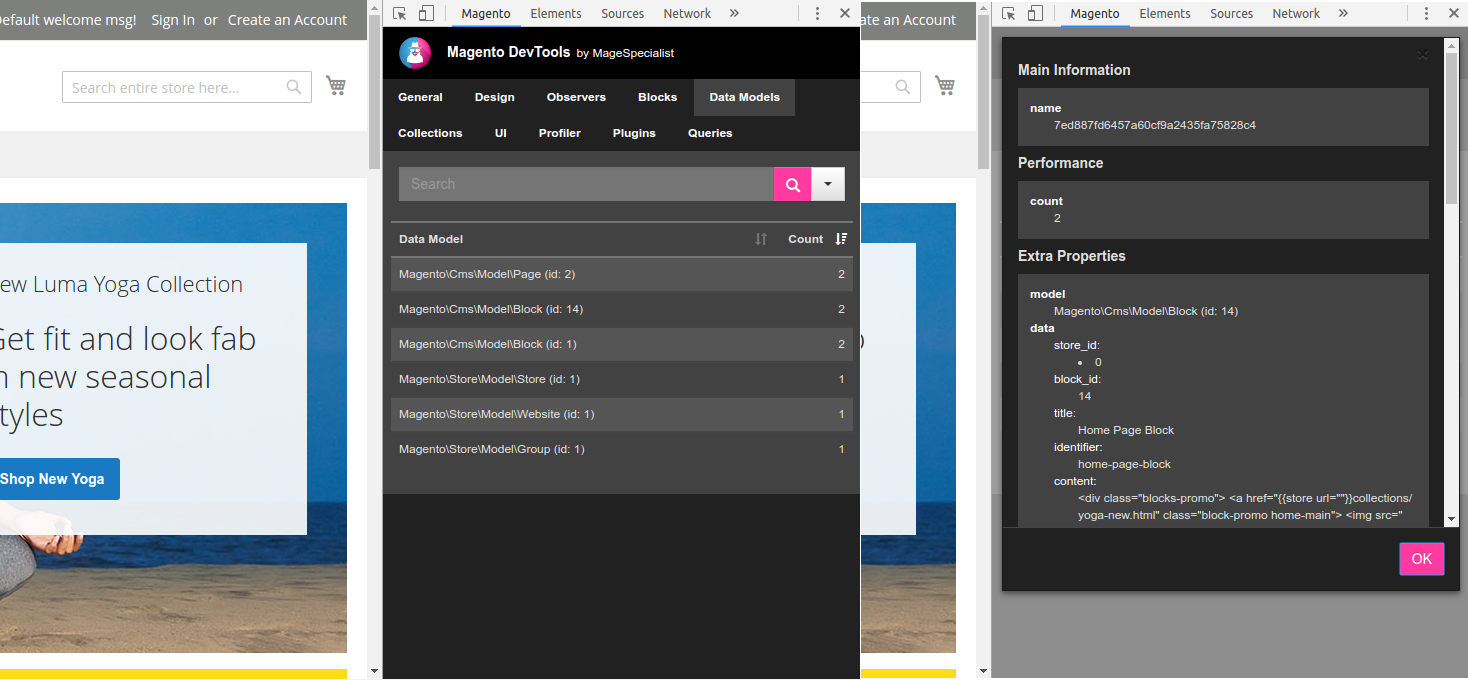
Data Models information:
Collections information:
Item Information
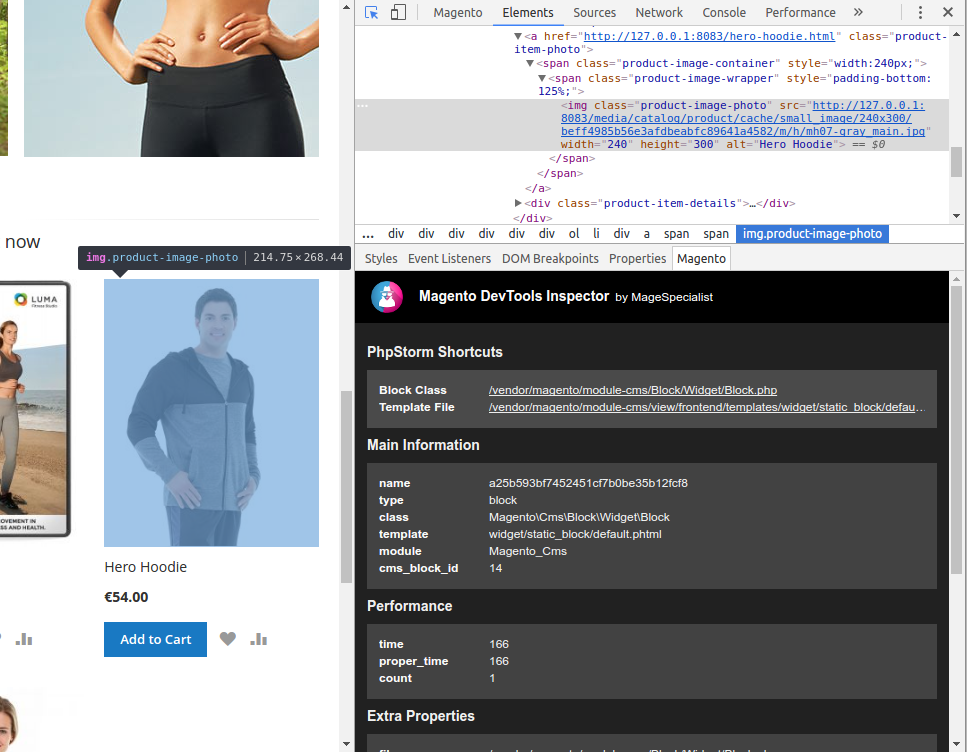
Magento Chrome Toolbar is integrated with Chrome Inspector.
By selecting an item in you page you can see:
- Block information
- Used template
- Server elapsed time
- Block nesting
- Template file
- Cache information
- uiComponent information
- Container information
PhpStorm Integration
Magento Chrome Toolbar can be integrated with PhpStorm to directly open the template file you wish to edit.
You need to install Remote Call Plugin in PhpStorm, then enable the feature from Magento Admin.

 Translates to: This extension has been disabled because it was deemed unsafe by the Chrome Web Store.


